Service

Nature-based Voluntary
Carbon Credit Evaluation
By combining remote sensing and causal inference technology, our service aims to enhance the transparency of carbon initiatives through an easy-to-understand visualization of the effects of both the reduction and absorption of greenhouse gas emissions in projects pertaining to afforestation or conservation of forests and peatlands. This enables highly accurate information to be provided at the early stages of considering investments and credit purchases, such as how much emission reductions can be expected from individual projects and what risks are involved.
Technical Features
Two-way communication platform
We provide a platform for two-way communication between carbon credit buyers and project developers, contributing to a clearer and more transparent sharing of project-related information.

Proved causal inference-based baseline quantification
Baselines (in other words, what would have happened if the project was not implemented) are crucial for determining the quality of carbon credits. However, they can be misreported, making a project appear more effective at reducing emissions than it actually is, leading to greenwashing criticism. We avoid that by using multiple approaches to validate our baselines and ensure their accuracy.
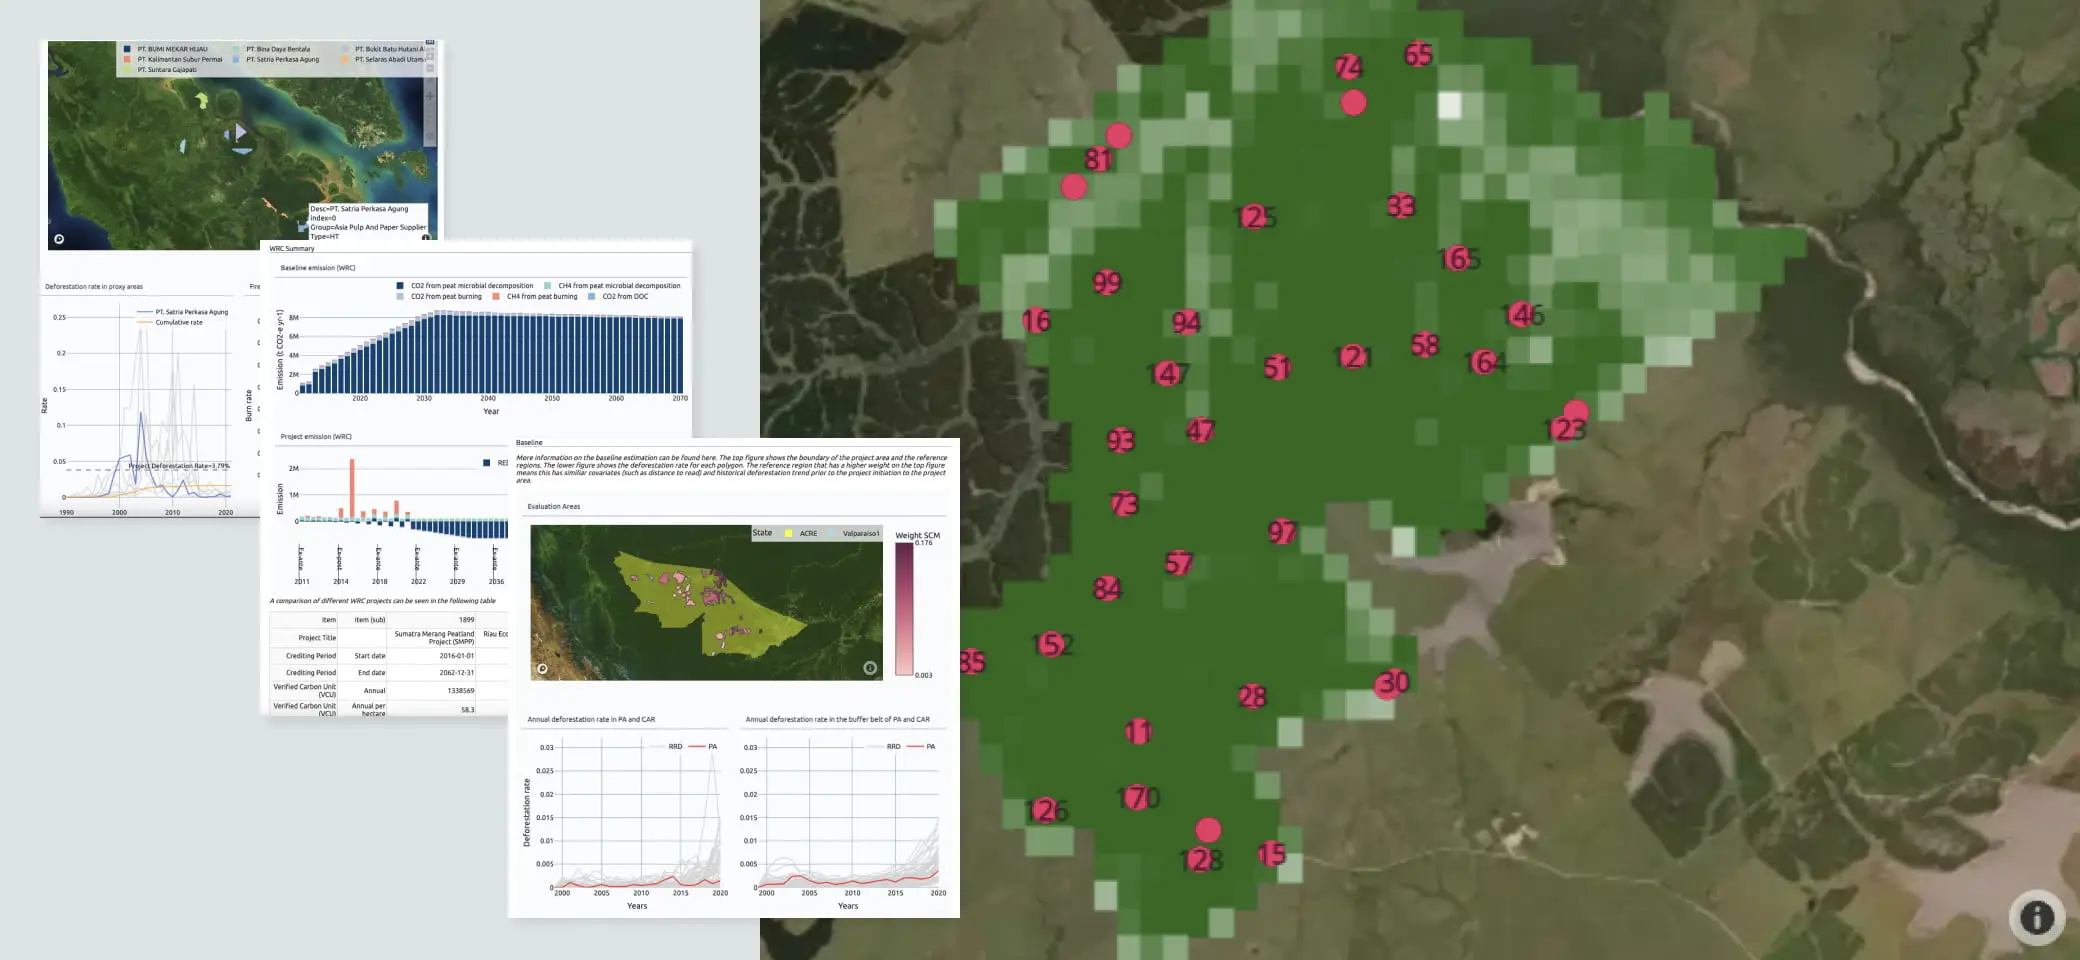
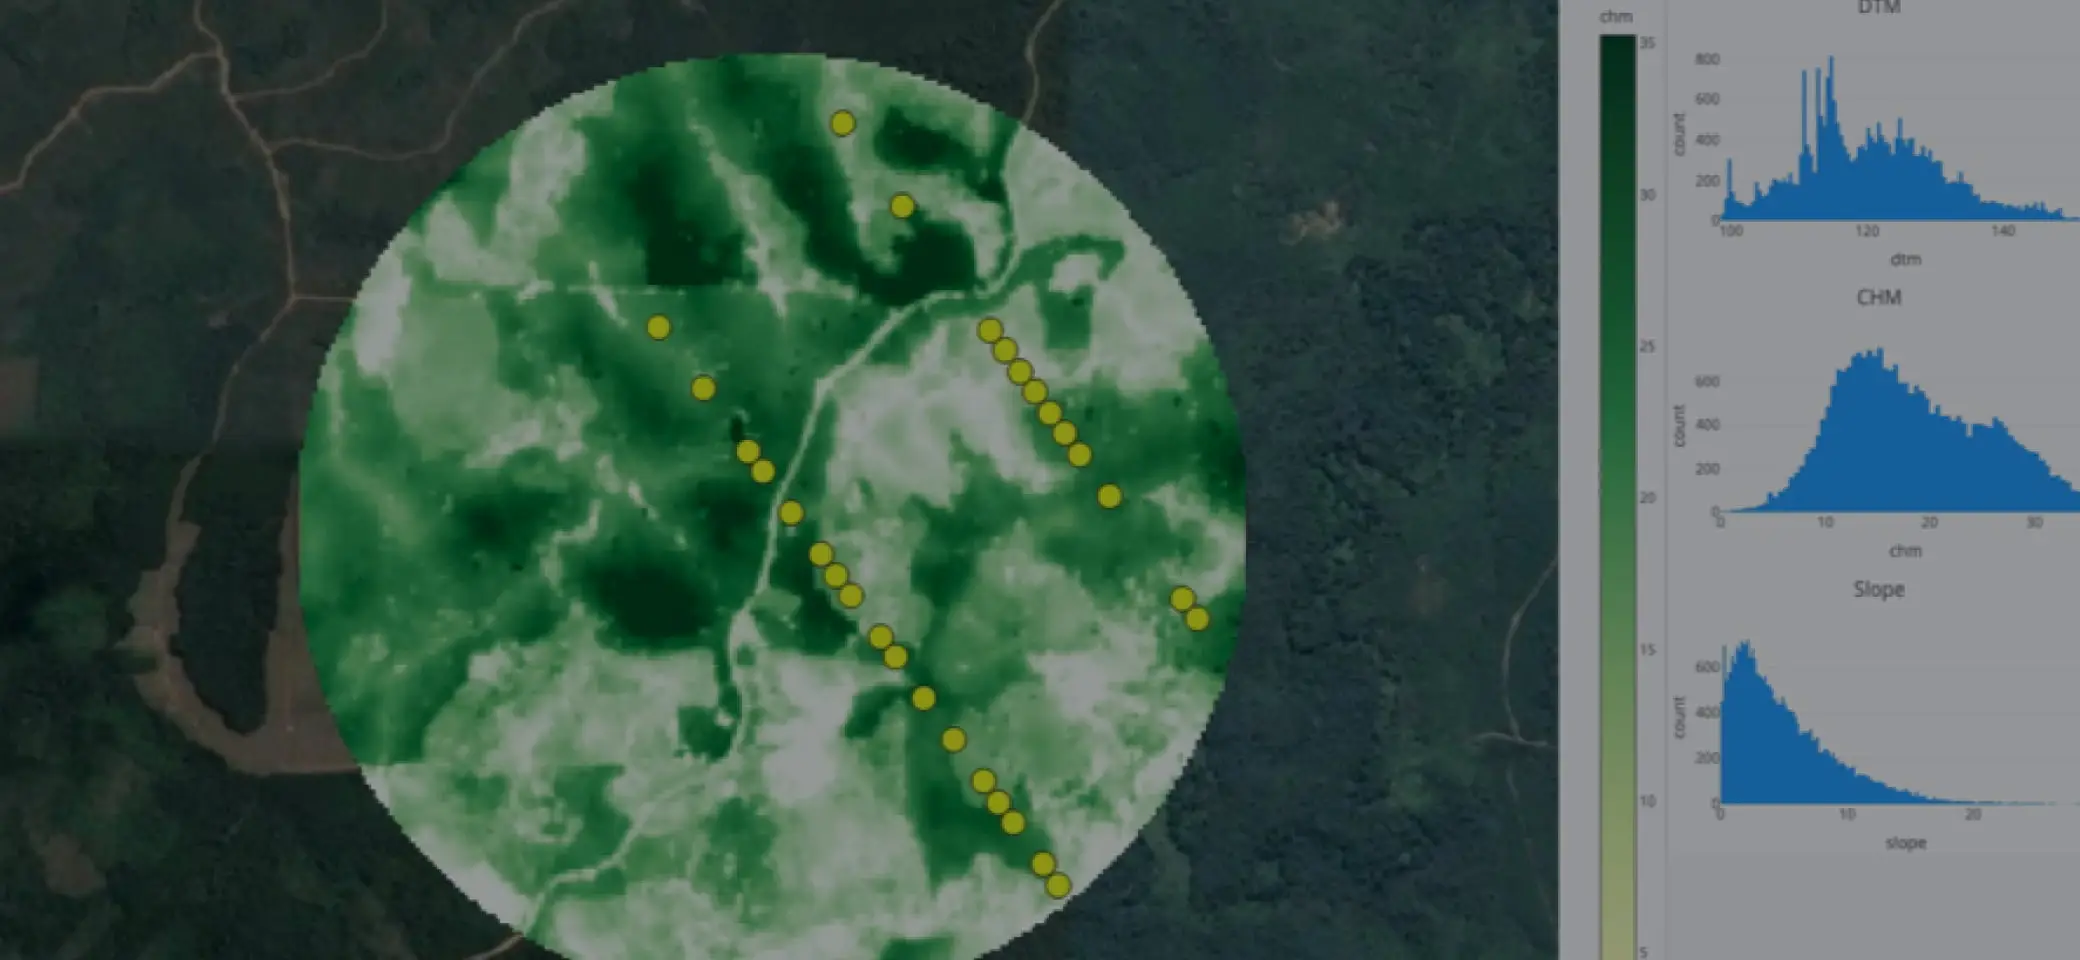
Easy-to-understand NbS Dashboard
Calculating greenhouse gas sinks and emission reductions in forest and peatland projects often requires specialized knowledge in forest science and ecology. The dashboard visualizes this technical information on a case-by-case basis, making it easy for project developers to explain the validity of the credit they estimate. Credit buyers can also carry out DD (due diligence) by comparing their project with other projects.
Case Studies
Carbon Credit Buyer

Project Developer (Environmental NGO)
MAP
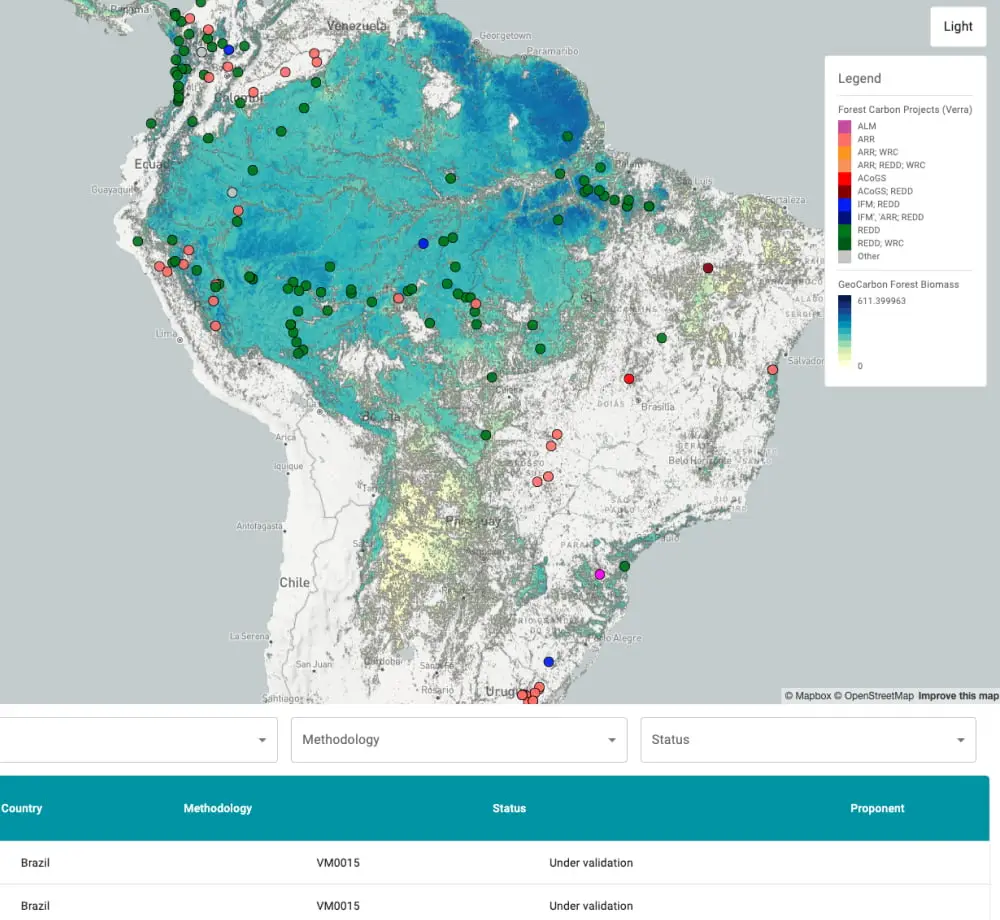
Forest Carbon Projects
This map visualizes forest carbon projects in voluntary credit market and their associated information using open data. It is designed to provide an overview around each project using several parameters, such as forest cover, forest gain or loss. Data is mainly available for South America, Southeast Asia, Southwest Asia and Africa.
Are you interested?
Let's schedule a meeting
Commercial Plantation
Forestry Monitoring
We will help forestry companies
(1) monitor their forests accurately in a cost-efficient manner to optimize their operation and
(2) explore extra business opportunities regarding carbon offsetting.
Technical Features
High-frequency tree growth monitoring
We have developed an integrated framework of satellite-based remote sensing and geospatial tree growth-model parameter estimation. Our technologies (accuracy and practicality) were proven at various forests across the globe.
Own terrain correction algorithm applied
By combining multi-modal remote sensing products, we have developed our own algorithm to obtain more accurate digital terrain information, which is crucial for precise forest parameter estimation.
Case Studies
Timber industry
Investors
You can send us an AOI
Nature and
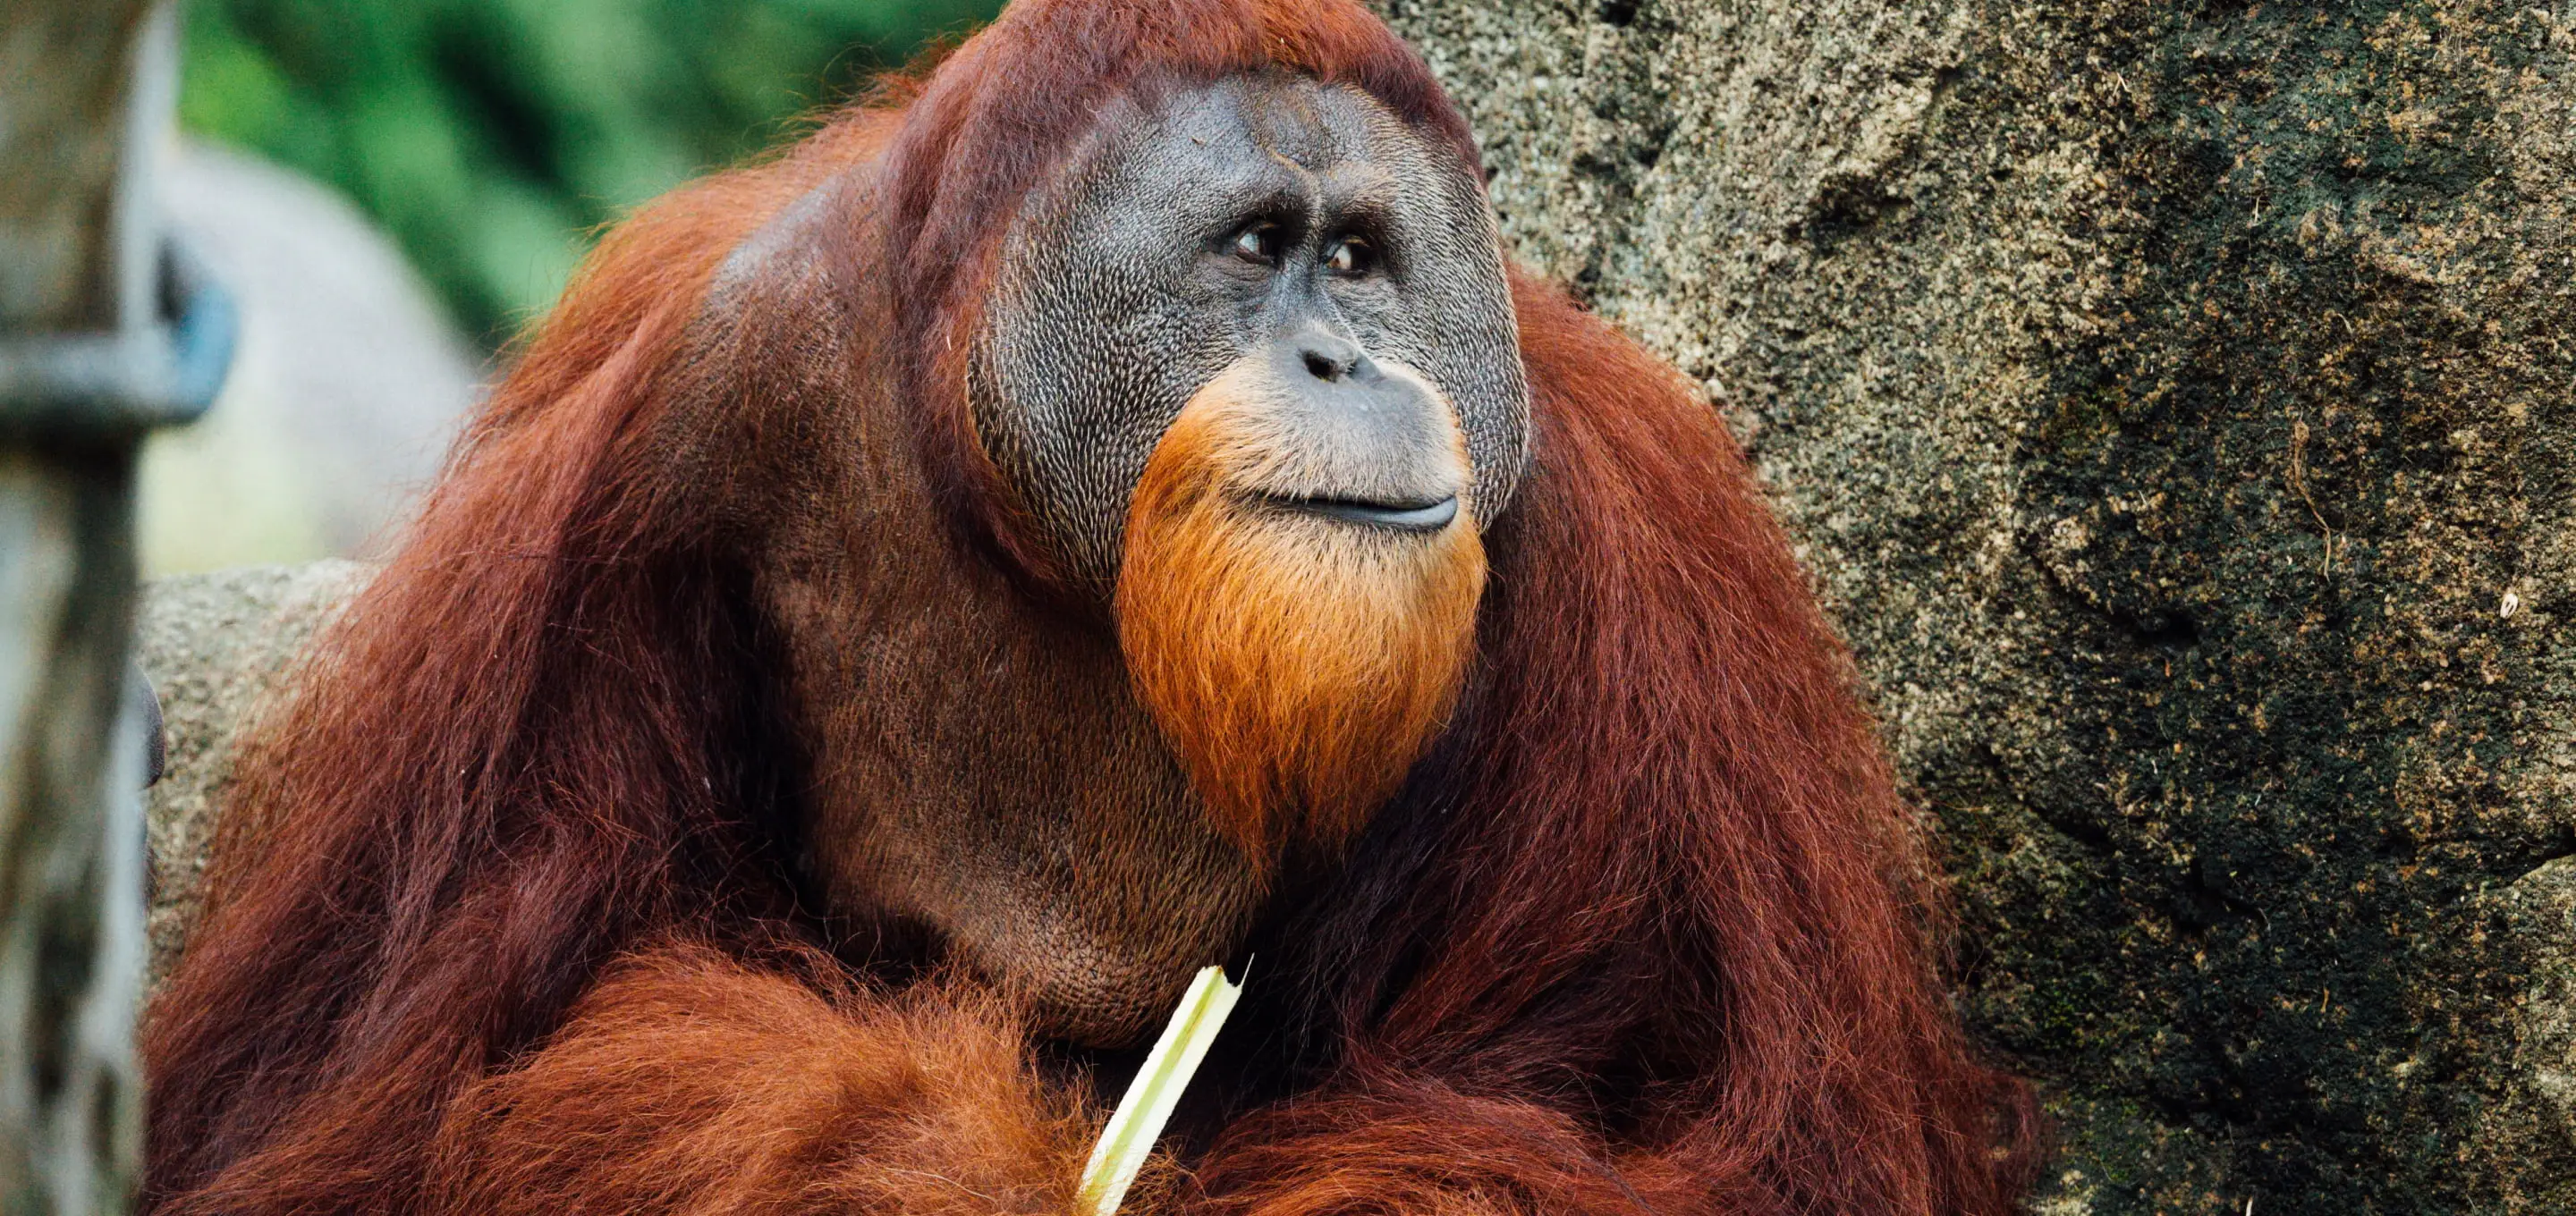
Biodiversity Monitoring
We assess the positive/negative impacts of nature conservation projects and corporate activities on biodiversity.
The value of transparent disclosure of information toward a nature positive world
Enterprises will be required to disclose both their nature-related and climate-related activities, and publishing such a huge number of metrics will inevitably be a significant burden. We at sustainacraft are capable to address this issue thanks to satellite-based remote sensing technologies that we are currently developing. With such technologies, enterprises could measure a robust selection of State of Nature metrics on a real-time basis at various sites across the globe, wherever their business operations are located. By combining our technologies and sector-specific models, companies would find themselves able to grasp their nature-related activities in a comprehensive and quantitative manner.
Technical Features
On-the-ground monitoring
We employ a variety of optical sensors, LiDAR, and radar to gather information about habitats, including their vertical forest structure and level of fragmentation. This data can then be used to calculate indicators to measure the level of biodiversity, which is helpful to evaluate the positive and negative effects of nature conservation efforts and corporate actions on biodiversity.
Are you interested? Let's schedule a meeting