Monthly: VCM Updates (February 2024)
This article is an automatically translated version of the original Japanese article. Please refer to the Japanese version for the most accurate information.
This is a newsletter from sustainacraft Inc. This edition provides a Monthly VCM Update, focusing on discussions regarding the convergence with compliance markets. This month, the volume of Retirements has significantly increased year-on-year, continuing the trend seen in November and December. While large-volume retiring players stand out, the number of entities retiring credits also increased last year, suggesting an increase in new entrants.
Monthly VCM Update
This month's content includes:
A. Voluntary Carbon Credit Market Trends
- Issuance / Retirement Analysis
- Project Pipeline Analysis
B. Trends in Major Overseas Regulations
- The Convergence of the Voluntary and Compliance Carbon Markets
- Specific Examples of Market Convergence
A. Voluntary Carbon Credit Market Trends (Verra)
Reference: We have published a market trend report on Voluntary Carbon Credits up to the end of 2023, which was used in a seminar at the end of last year (English version, Japanese version).
1) Issuance / Retirement Analysis
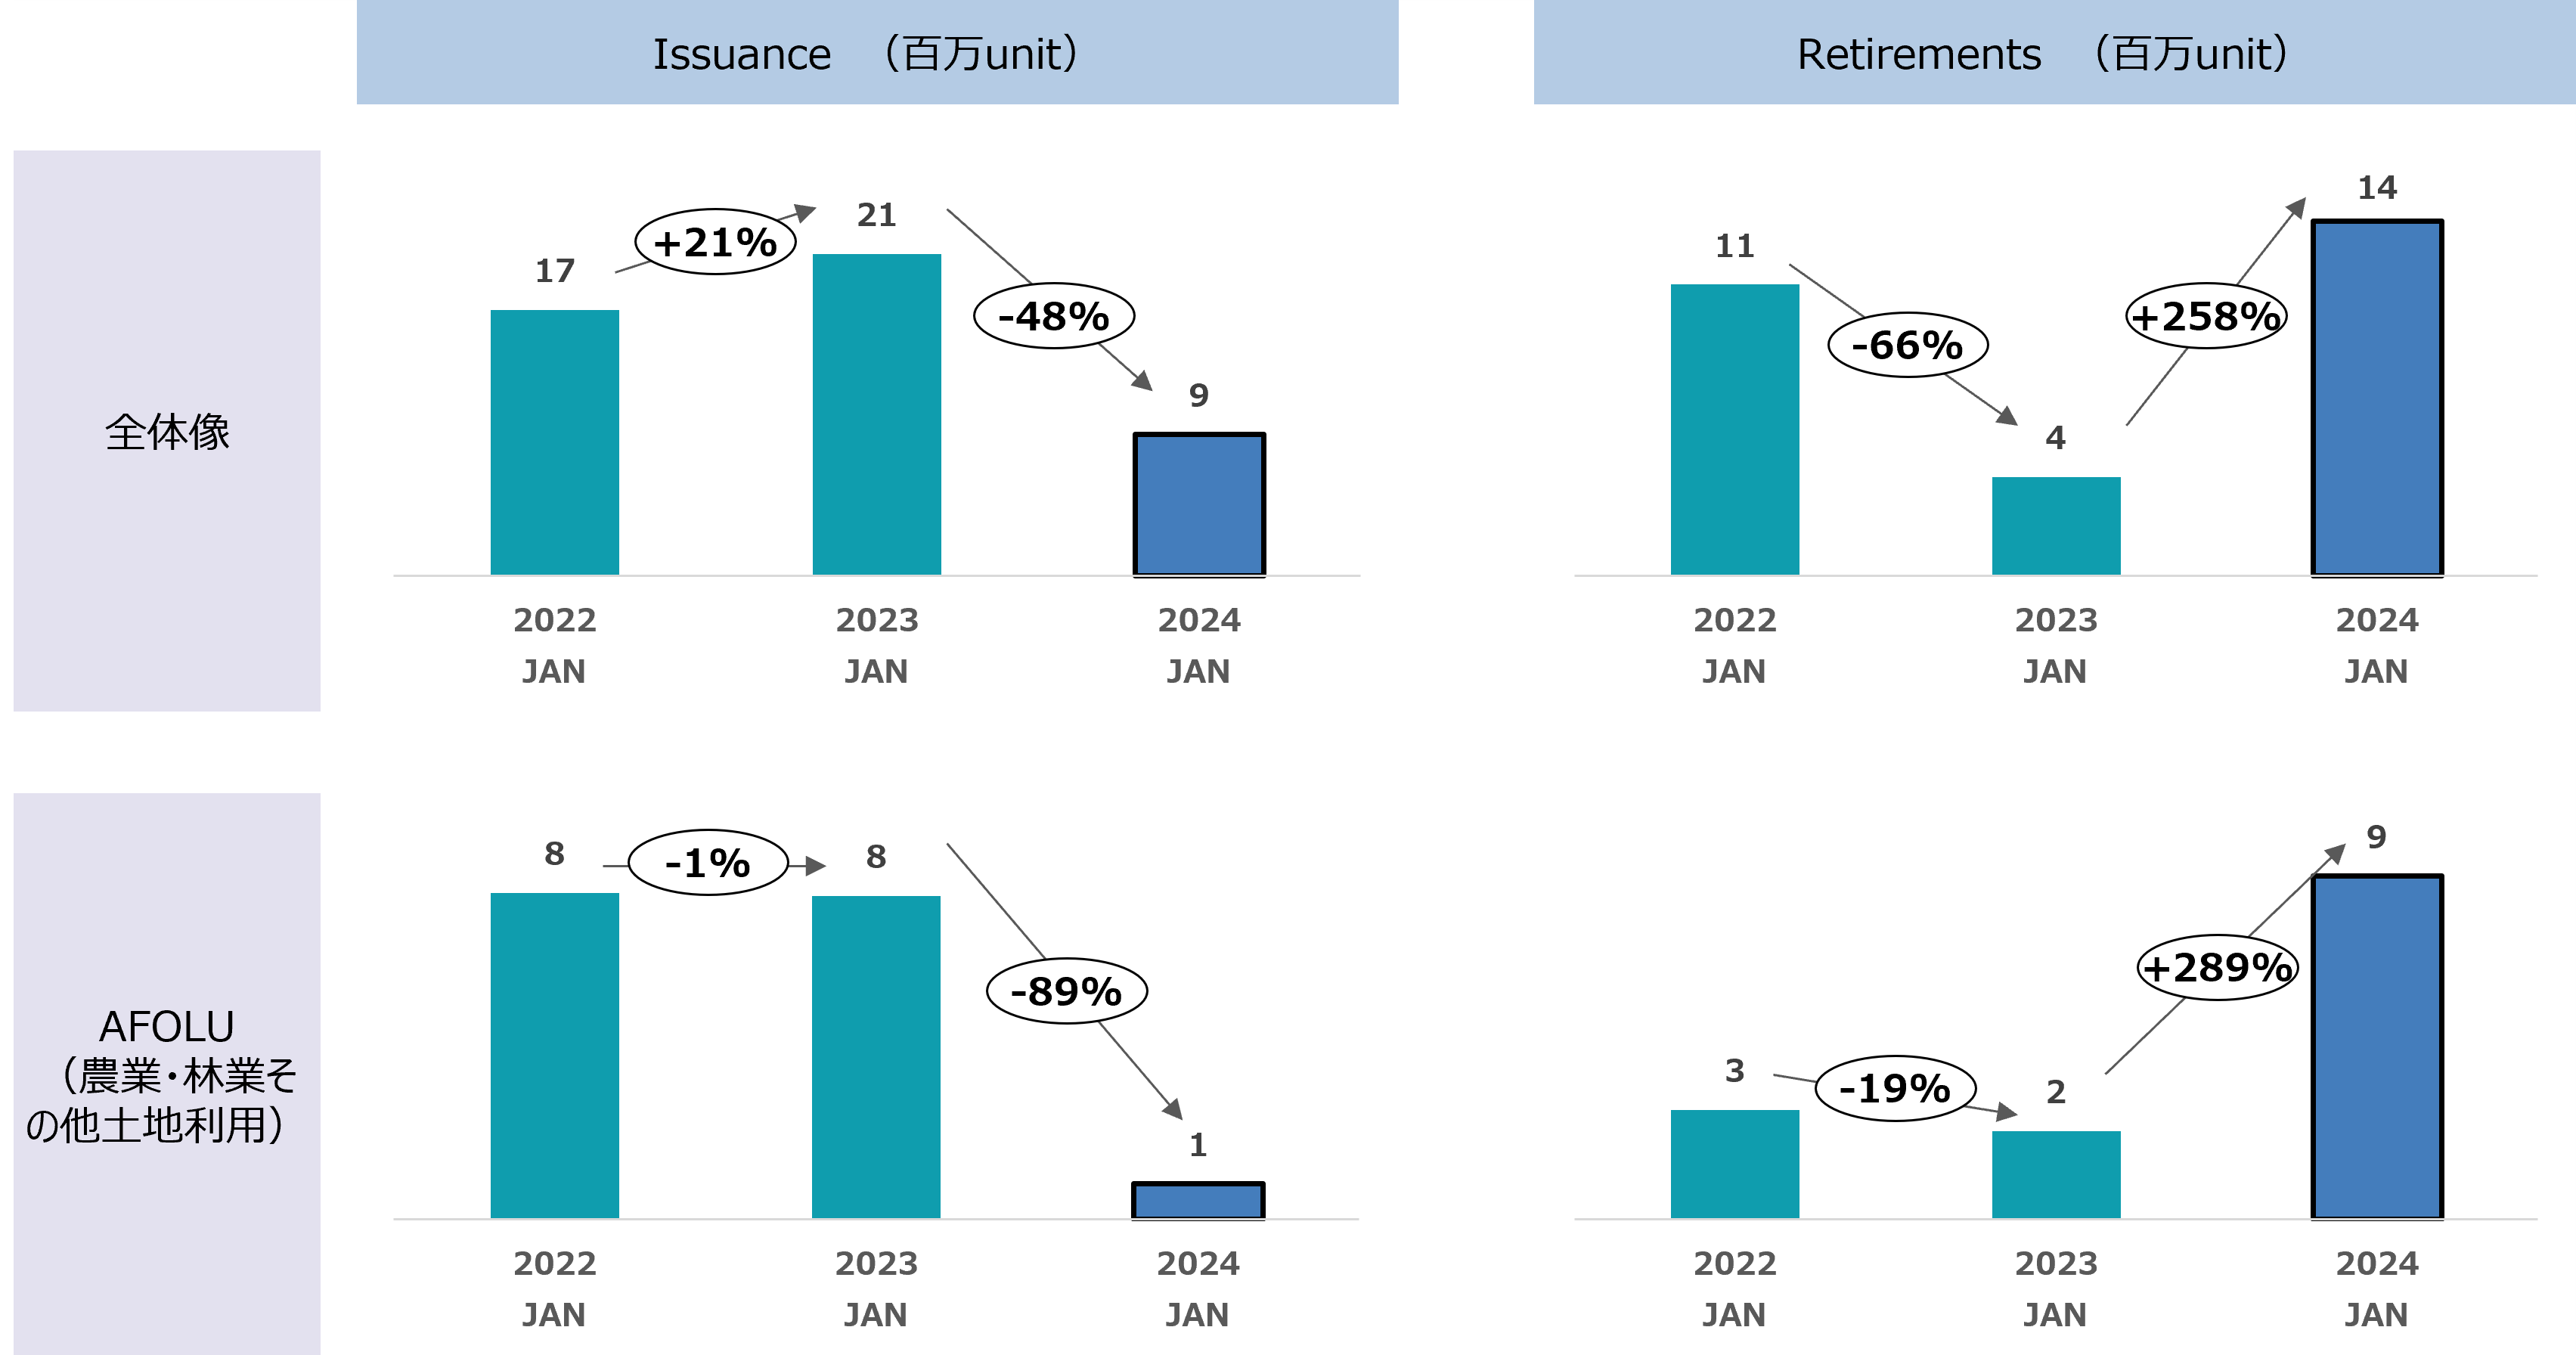
In January 2024, 9,205,885 units of Verra Voluntary Carbon Credits were newly Issued, and 13,882,075 units were Retired. These figures represent year-on-year changes of -56% and +258%, respectively.
Focusing solely on AFOLU (Agriculture, Forestry and Other Land Use) projects, 915,393 units were Issued, and 8,847,878 units were Retired. These represent year-on-year changes of -89% and +289%, respectively.
Following November and December of last year, corporate Retirement volumes have increased year-on-year. While December saw a +86% increase year-on-year (AFOLU sector), January experienced a significant increase of +289%. The breakdown of this will be discussed later.
In contrast, the volume of new Issuances has significantly decreased. This may be partly due to delays caused by Methodology updates and the prolonged certification process for new projects and new Issuances.
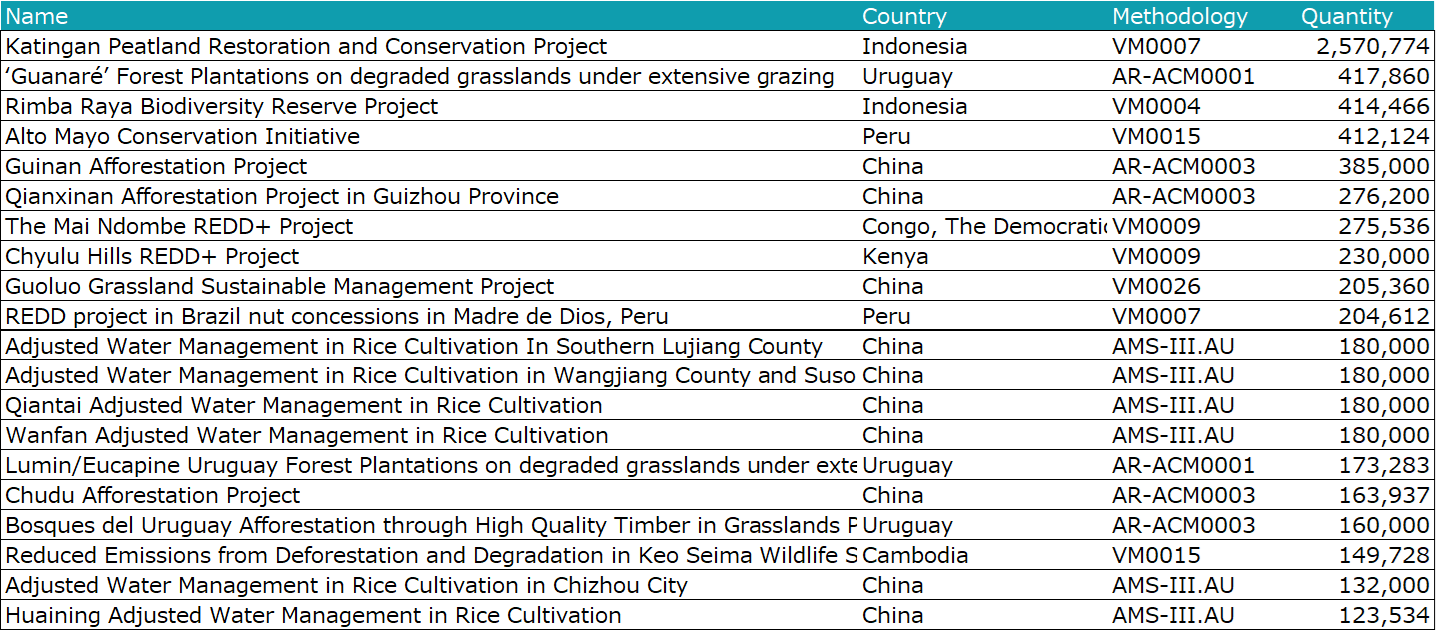
Here is a list of projects Retired in December 2023 (AFOLU sector only). The top 20 projects account for 80% of all Retirements. By country, Indonesia is the largest (34%), followed by China (28%), Peru (9%), Uruguay (9%), and Brazil (6%).
Shell has Retired 1.08 million VCU from the Katingan project.
The top 20 companies that Retired carbon credits in the Verra AFOLU sector are listed below. Continuing from November and December, Shell's Retirement volume is very large. This month, in addition to Shell's Retirements, Takeda Pharmaceutical Company also undertook large-scale Retirements. These two companies are driving Retirements in the AFOLU sector.
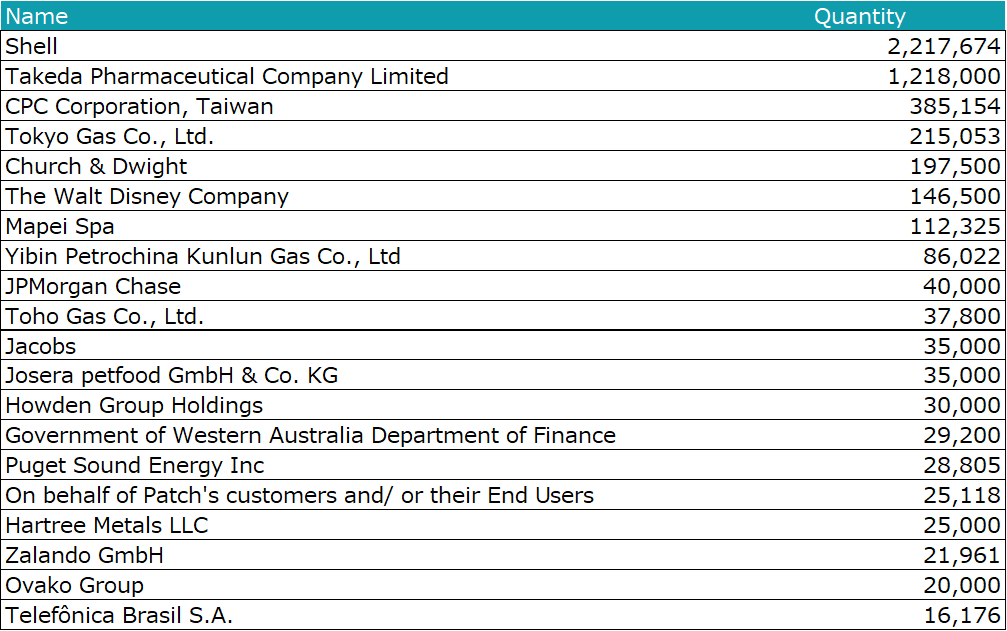
Takeda Pharmaceutical Company has Retired recently Issued removal credits from China, Uruguay, and Pakistan. Credits Issued in 2023 are also included.
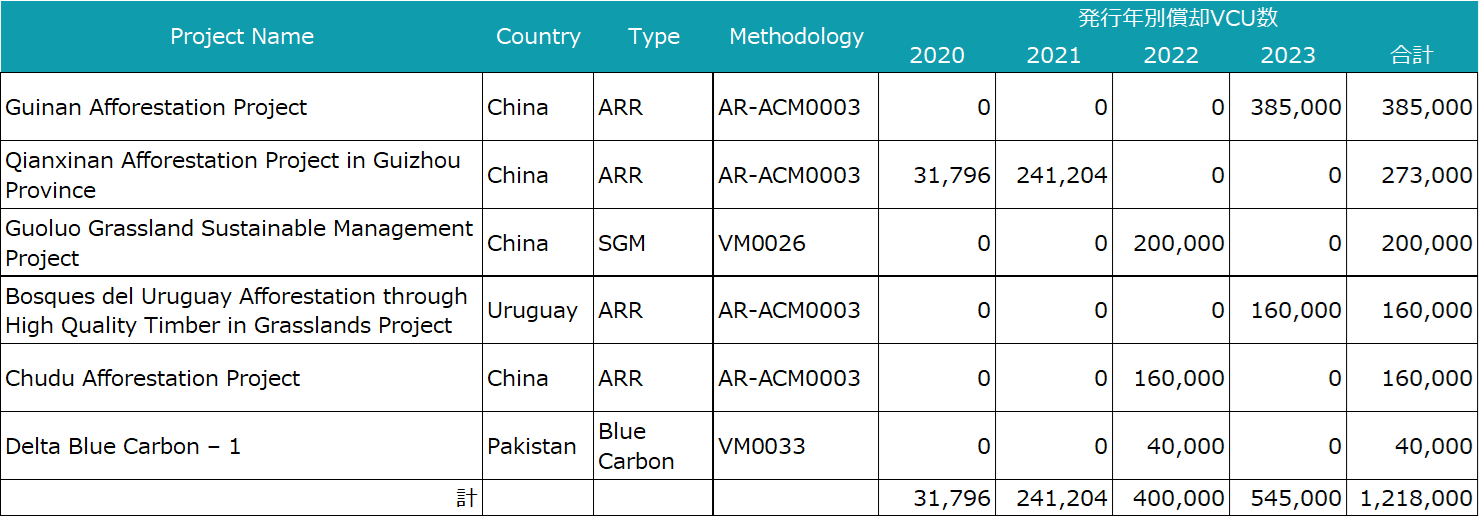
When viewed by Vintage, only credits with Vintages from 2017 onwards have been Retired. This suggests a preference for more recent Vintage credits, which is consistent with one of their proprietary procurement conditions to prioritize credits with a Vintage within three years.
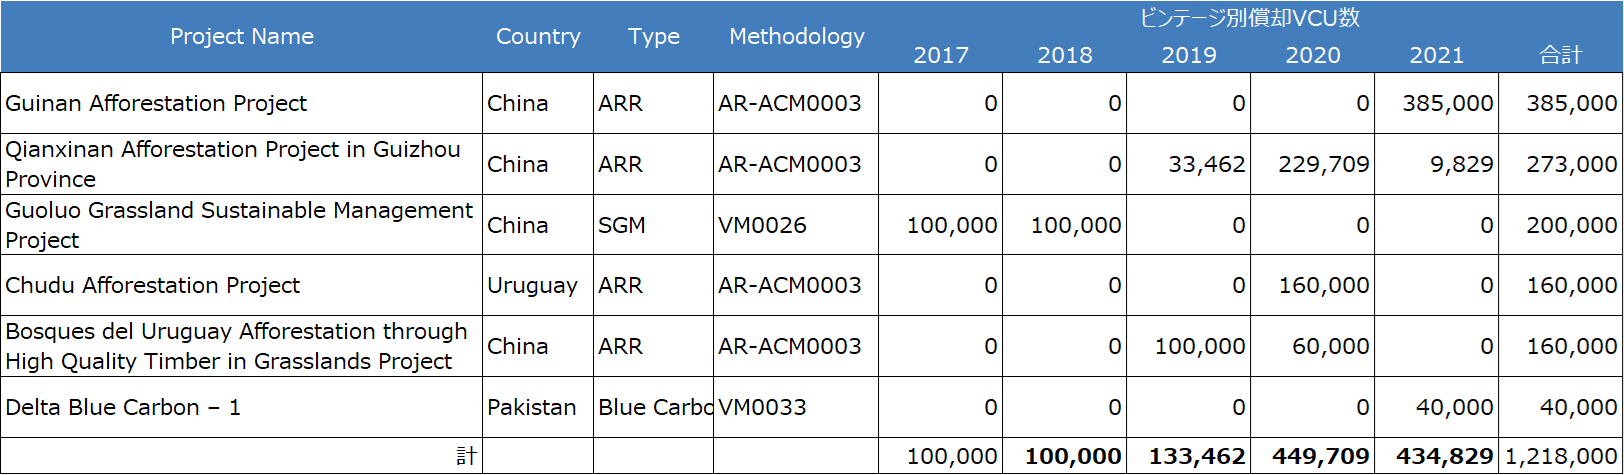
Experimentally, we compared this to the credit conditions usable under the ISO14068-1:2023 carbon neutrality standard. ISO14068 allows the use of credits with a Vintage up to five years prior to the start date of the relevant fiscal year. Therefore, approximately 1.12 million VCU (bolded portion in the table above) out of approximately 1.22 million VCU meet this standard. We have also covered ISO standards in this article. Please take a look.
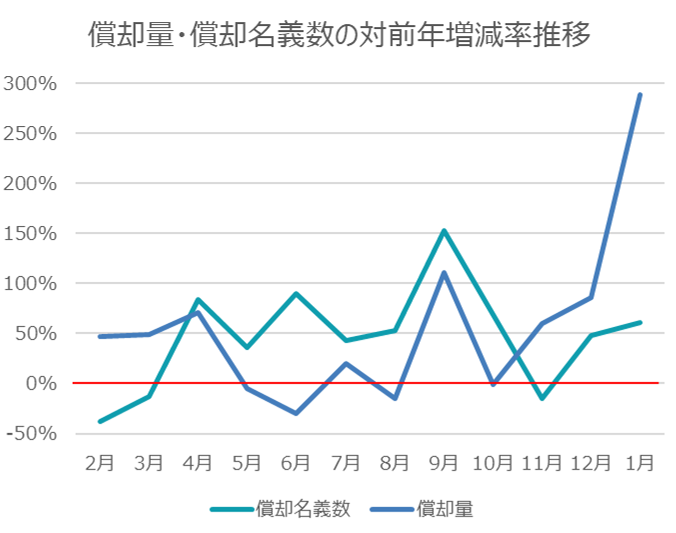
While the increase in Retirements by large corporations is notable, the number of entities undertaking Retirements also shows an increasing trend year-on-year. In 9 out of the past 12 months, the number of entities undertaking Retirements has increased year-on-year, with a cumulative increase of 38%. This suggests an increase in new entrants.
2) Project Pipeline Analysis
Below, we show the monthly Pipeline trends by project sub-type. The upper panel represents the number of projects, and the lower panel is based on annual ER (Emission Reduction or Removals). The horizontal axis is based on the Listing Date1
Please note that there is some time lag for data to be reflected in the registry, so the figures for January 2024 may increase in the future. Data for December 2023 has also increased compared to the previous update.