REDD Project Approach
This article is an automatically translated version of the original Japanese article. Please refer to the Japanese version for the most accurate information.
Basic Knowledge of Nature-based Carbon Credits
The Impact of Deforestation on Climate Change
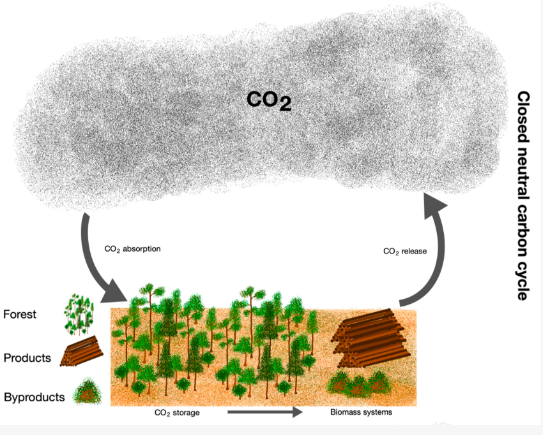
As forests grow, they absorb Carbon Dioxide from the atmosphere and store it in their trunks, roots, and leaves. In this way, they remove Carbon Dioxide from the atmosphere and contribute to climate change mitigation. On the other hand, when forests are cut down, they are used as fuel or wood products, eventually releasing Carbon Dioxide into the atmosphere. While initiatives like afforestation absorb Carbon Dioxide from the atmosphere, preventing Deforestation (REDD) also prevents Carbon Dioxide release into the atmosphere, thus contributing to climate change mitigation in the same way as afforestation.
(Source: Leonel J.R. Nunes et al. Climate 2020, 8(2))
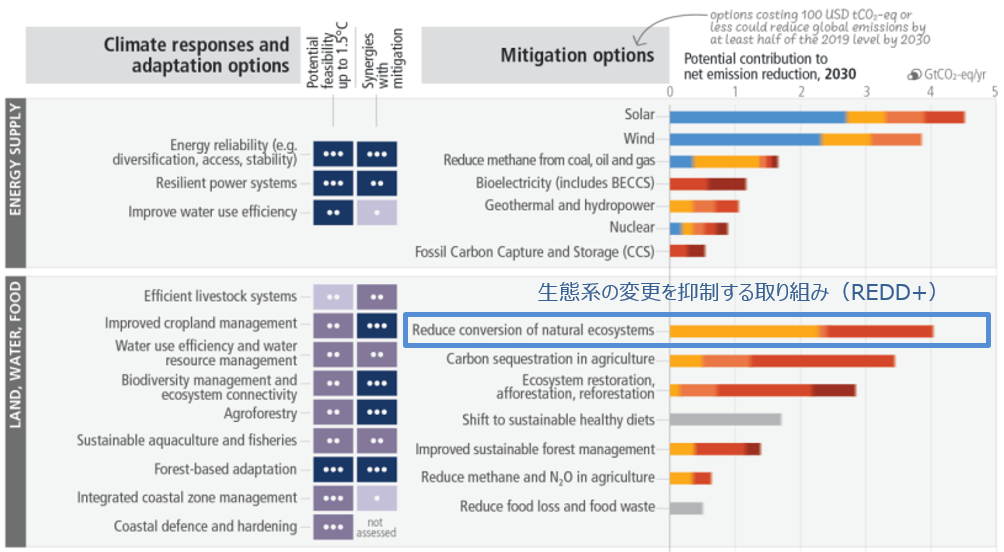
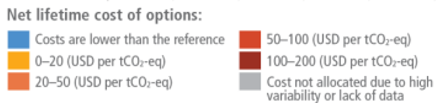
According to the IPCC Synthesis Report, total GHG Emissions from Deforestation amount to approximately 4 GtonCO2-e. Preventing Deforestation is attracting attention as a promising means for climate change mitigation, partly because its implementation cost is lower compared to other methods. The color of the bars in the figure below represents the cost of implementing each measure. REDD is a measure with a mitigation potential of 2GtCO2-e at a cost of less than 20 USD. It is a promising option for large-scale and inexpensive Emission Reduction, second only to solar and wind power.
(Source: AR Synthesis Report)
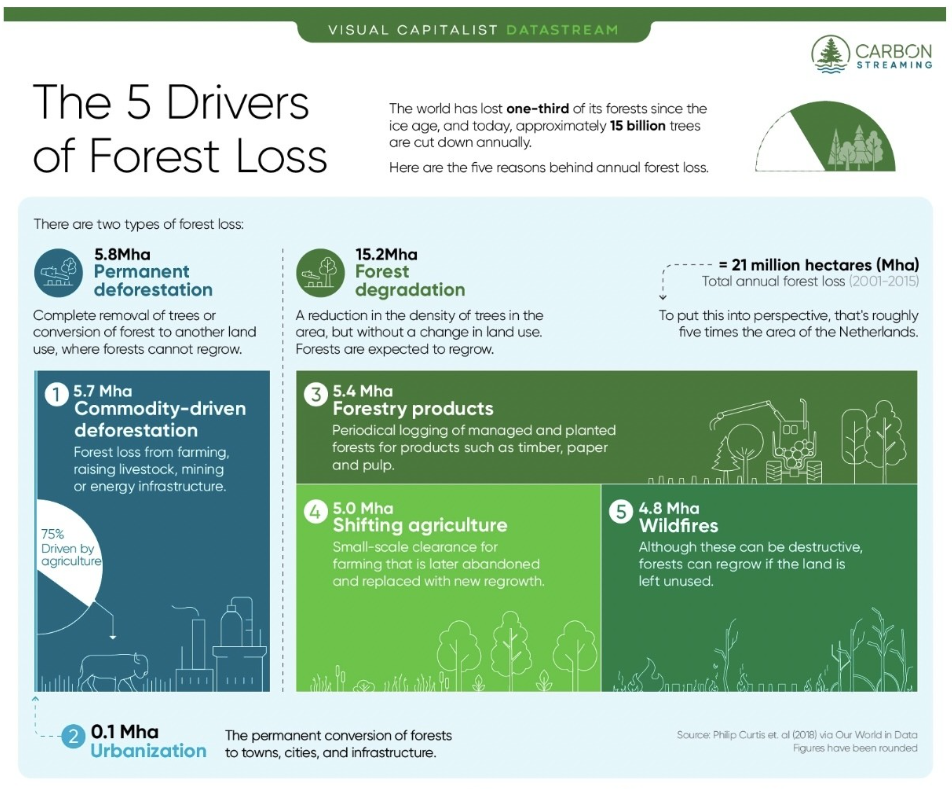
Means of Deforestation Prevention
Deforestation occurs for various reasons. These include conversion to agricultural land, timber use, and fires.
(Source: World Economic Forum)
Similar to other Methodologies, a "results-based payment" system is applied to REDD projects, allowing for the Issuance of Carbon Credits as "compensation for actual Emission Reductions." This mechanism incentivizes Project Developers to continue operating their projects effectively.
Carbon Credit Generation by REDD and the Risk of Greenwashing
As a recent Guardian article claimed that over 90% of forest Carbon Credits issued by Verra are worthless, questions have been raised about whether Carbon Credits generated by REDD projects are being overvalued.
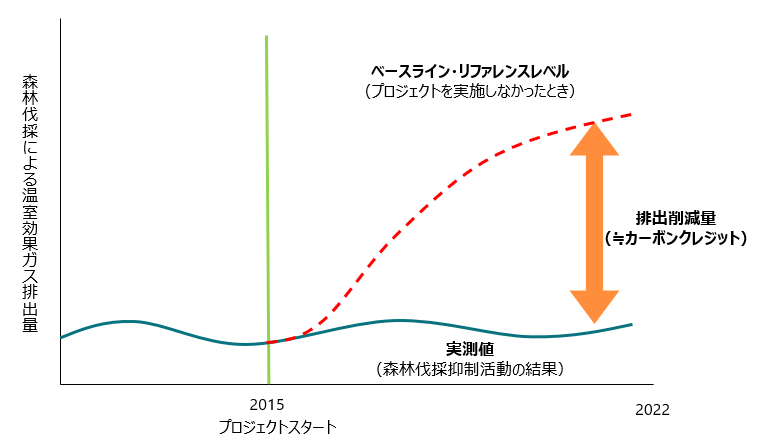
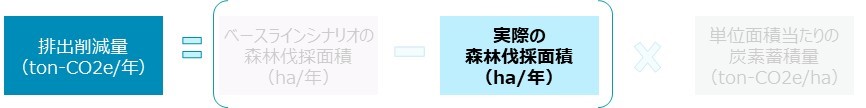
REDD projects are implemented in areas facing a significant threat of Deforestation. These projects contribute to climate change mitigation by preventing Deforestation and the associated Greenhouse Gas Emissions that would have occurred had the project not been implemented.
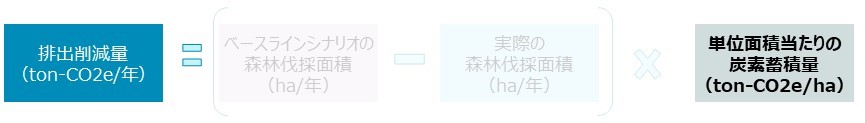
The contribution of such a project, i.e., the Emission Reduction (≒Carbon Credit), is represented by the difference (orange double arrow) between the Emissions in the Baseline scenario (red dotted line below) and the actual measured value (green line below).
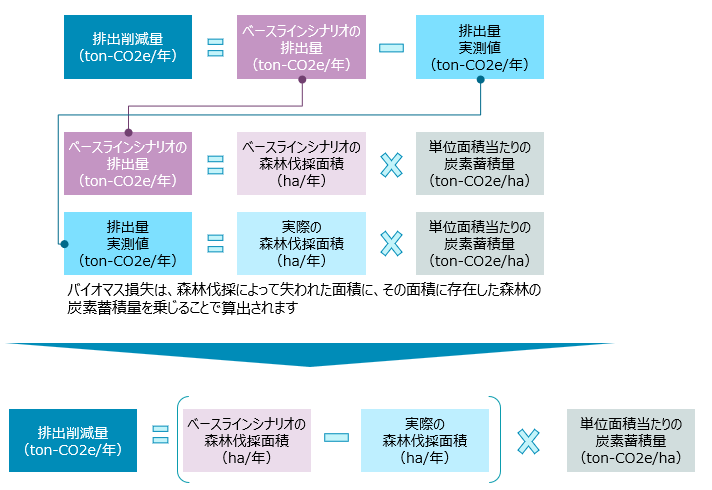
So, under what circumstances can "overestimation" of Emission Reductions occur? Below, we list three potential drivers.
※Although a portion of the Emission Reductions must be transferred to the Buffer Pool, meaning not all Emission Reductions can be issued as Carbon Credits, for simplicity, we treat "Emission Reduction ≈ Carbon Credit" here.
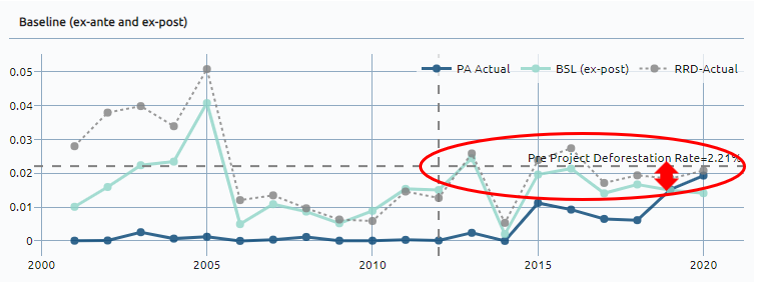
1) "Overestimation" of Deforestation Area in Baseline Scenario
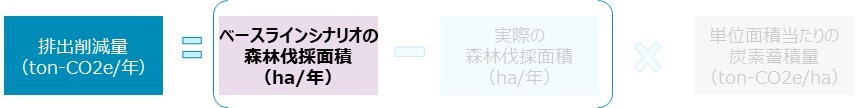
Below is an actual analysis example of a REDD project. The gray dotted line (horizontal axis) represents the Deforestation rate in the Baseline scenario set before the project. In contrast, the light green line indicates the Deforestation rate set using the Causal Inference method. While some values set by the Causal Inference method are below the Baseline scenario, the levels of both generally align, suggesting that the risk of Baseline "overestimation" in this project is not significantly high.
On the other hand, in the next project, a significant discrepancy is observed between the Baseline Deforestation rate and the Deforestation rate determined by the Causal Inference method. While it is difficult to make a definitive judgment based solely on this information, this project is considered to have a high risk of "overestimation".
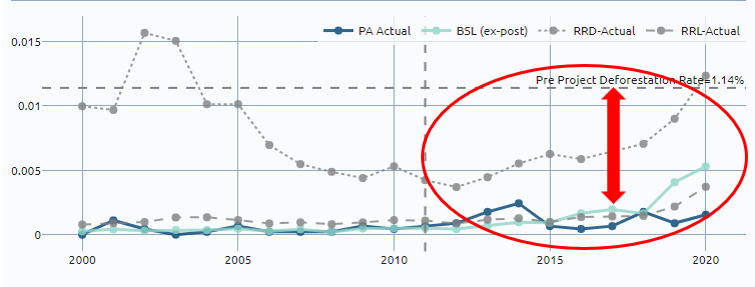
※It is important to emphasize that the Project Developers are not intentionally or deliberately "overestimating." Even if a project is designed and developed according to currently approved REDD Methodologies, cases where the Baseline results in an "overestimation" can still occur. Based on analyses like those above, it is necessary to engage in dialogue with Project Developers to gain a deeper understanding of the project.
2) "Underestimation" of Actual Deforestation Area
Several algorithms exist for estimating Deforestation area using satellite imagery. Some of these algorithms may underestimate the actual Deforestation area. Therefore, by comparing the Deforestation area reported by the Project Developer with estimates from various other algorithms, the risk of "underestimation" mentioned above can be checked.
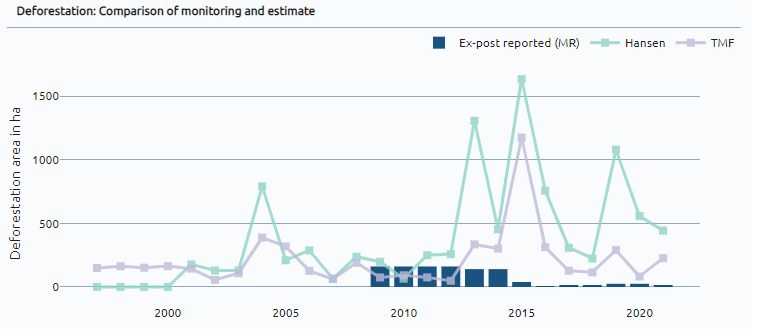
An example is shown below. The dark blue bars represent the Deforestation area reported by the Project Developer. In contrast, the line graph shows estimated Deforestation areas for the same project area based on multiple algorithms.
For the REDD project shown below, the reported values from the Project Developer generally align with the measurements from other algorithms. Therefore, the risk of "underestimation" regarding the actual Deforestation area can be considered low.
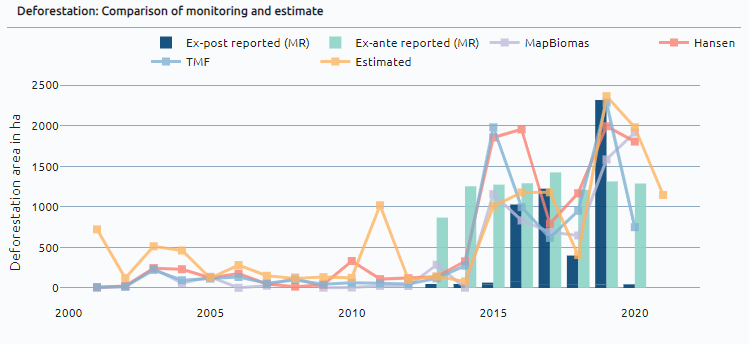
On the other hand, for the REDD project shown below, the absolute values and trends of the Deforestation area reported by the project show clearly different behavior compared to the Deforestation rates identified by other algorithms. Such projects are considered to have a high risk of "underestimation" and require more in-depth analysis.
3) "Overestimation" of Carbon Stock
However, since carbon stock is a critical driver in determining the final Emission Reduction, some may be curious about the magnitude of this parameter when compared to other projects.
Below is a comparison table of carbon stock (including above-ground, below-ground, and all other components) used in REDD projects, based on partial extracted data. The multiple bars below represent the carbon stock of different projects and different areas. The smallest is estimated to be around 200 ton CO2-e/ha, while the largest exceeds 1500 ton CO2-e/ha.
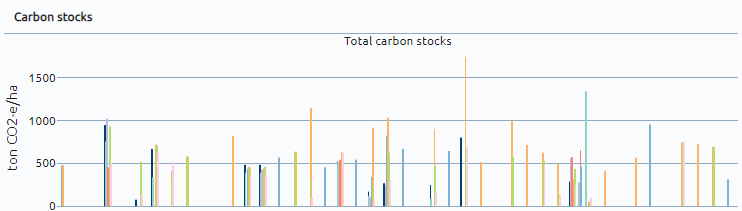
Since REDD projects target forests in various climate zones and regions, simply using a higher parameter compared to other projects in the above comparison does not immediately indicate "overestimation." For a more accurate understanding, we recommend conducting deeper analyses, such as comparisons limited to similar climate zones and regions.
Our company profile materials are available here for your reference.
Disclaimers:
This newsletter is not financial advice. So do your own research and due diligence.