Taskforce on Nature Markets / Guide on Biodiversity Measurement Approaches
This article is an automatically translated version of the original Japanese article. Please refer to the Japanese version for the most accurate information.
We are pleased to deliver the second newsletter from Sustainacraft Inc.
In our first newsletter, we introduced news related to Nature-based Solutions (NbS), specifically the SBT (Science Based Targets) FLAG sector guidance, Ceres' use and evaluation of Carbon Credits, and Spatial Finance in connection with "the importance of location-linked data."
This time, as recent news, we will introduce the Taskforce on Nature Markets, a movement for capital flow in the Natural Capital (Nature) sector, and Biodiversity measurement approaches (MSA).
Pickup Section
Taskforce on Nature Markets
(Source, March 2022)
In the field of Climate Change, market mechanisms have long been utilized to address economic externalities. Their importance was re-recognized at COP26, and significant reports on Carbon Markets have continued to emerge since the beginning of this year.
Biodiversity, like Climate Change, has been considered a crucial issue to be solved in the SDGs (Goal 15) and a typical example of a negative externality. Despite this, while Carbon Markets have been in operation for a long time in Climate Change, similar market mechanisms have not yet been introduced in the Biodiversity domain.
One reason is the insufficient availability of reliable indicators for assessing Biodiversity, and the data required to derive those indicators. Even in the beta version of TNFD released the previous day, it was pointed out that current data is inadequate.
The TNFD’s research has indicated that a significant amount of nature-related data is already available, from public, NGO and commercial sources. However, gaps remain, and data quality and consistency vary considerably across different regions, biomes and ecosystems. Over time these gaps will be filled and organisations are already using – and can start working on – what is available today.
Against this backdrop, the Taskforce on Nature Markets was established on March 31st by the Finance for Biodiversity Foundation. It aims to achieve capital flow to Natural Capital, including Biodiversity, which has not received much attention until now.
Taskforce on Nature Markets that has been established with the aim of shaping a new generation of purposeful nature markets that deliver nature positive and equitable outcomes.
This movement is also considered to be conscious of the excessively active Carbon Market. It emphasizes that a mechanism overly focused on decarbonization should not negatively impact Natural Capital like Biodiversity.
Unchecked monetarisation of nature could lead to its further depletion and damage. For example, unintended consequences could arise from an over-emphasis on markets predicated on one measurable metric (say, carbon reduction or offsets) while missing and negatively impacting other aspects of biodiversity.
On the other hand, the mechanisms for realizing objective and transparent transactions of Natural Capital are still under preparation, and specific monitoring methods and indicators have not yet been discussed.
The development of future monitoring methods and indicators is highly anticipated to ensure appropriate consideration for Natural Capital within the framework of capitalism.
Guide on Biodiversity Measurement Approaches - MSA (Mean Species Abundance)
(Source, January 2022)
In the Taskforce on Nature Markets, publications by organizations such as the Finance for Biodiversity Foundation (F4B) are mentioned as Biodiversity measurement approaches. F4B's report from January of this year highlighted three indicators for assessing Biodiversity: MSA (Mean Species Abundance), PDF (Potentially Disappeared Fraction), and STAR (Species Threat Abatement and Recovery).
MSA, translated as Mean Species Abundance, is an indicator that shows the extent to which the number of endemic species living in a specific area remains compared to an undisturbed pristine ecosystem. This MSA was used in the OECD's quantitative scenario technique (GLOBIO) to predict Biodiversity loss by 2050. It is considered an important indicator for assessing Biodiversity.
Measuring MSA requires assessing endemic species in each location. In the aforementioned GLOBIO, calculations and evaluations are performed based on causal relationships derived from meta-analyses of past literature and surveys. Specifically, MSA for each location is calculated using five elements that significantly impact MSA: 1) land use, 2) nitrogen deposition, 3) infrastructure development, 4) forest fragmentation, and 5) Climate Change (Alkemade et al 2009).

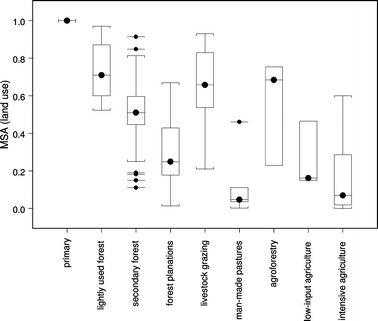
Let's introduce some specific examples. Regarding 1) land use methods, previous studies have clarified the impact of differences in land use on MSA. By using location-specific land use information stored in databases such as Global Land Cover and data on the impact of land use on MSA, it is possible to assess the global impact of land use on Biodiversity.
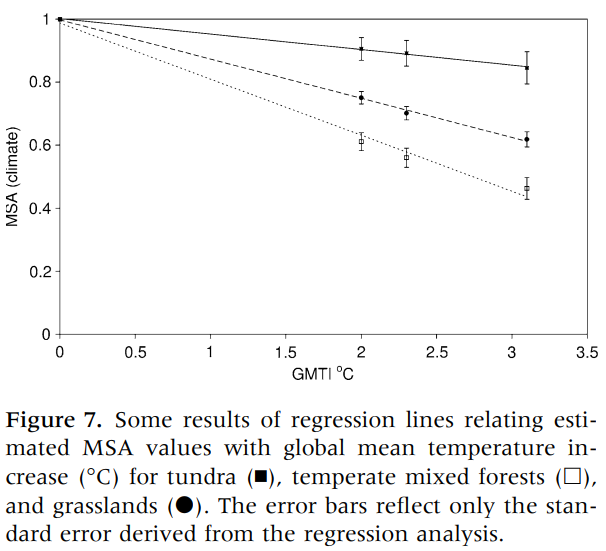
Furthermore, 5) the impact of temperature increase on Biodiversity is also evaluated through meta-analysis.
Based on such meta-analyses, causal relationship equations, and projected changes in each indicator, Alkemade et al. evaluated Biodiversity at a global level using MSA and demonstrated that MSA and the GLOBIO technique are useful tools to support decision-making related to Biodiversity at national and regional levels.
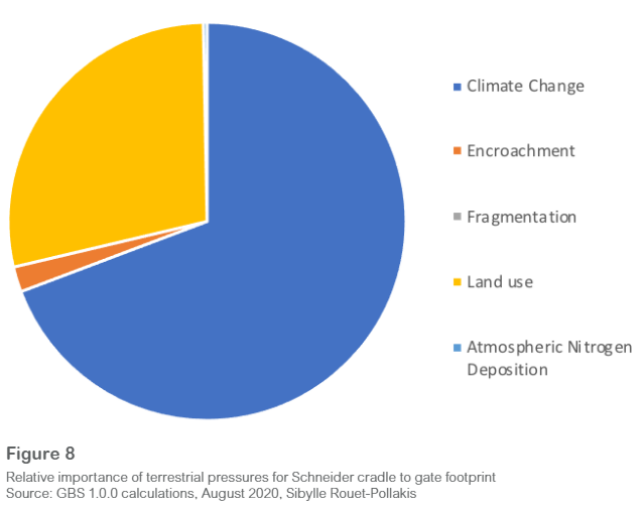
However, this GLOBIO model is not suitable for assessing the impact of corporate activities on Biodiversity because its spatial resolution is coarse and it is not linked to corporate activities. Tools for evaluating corporate-level MSA include the GBS (Global Biodiversity Score) developed by CDC Biodiversite in France.
GBS provides a methodology for evaluating the overall impact of corporate activities on MSA, based on quantitative information of drivers affecting Biodiversity within corporate activities. France's Schneider Electric has actually used this tool to assess its own impact on Biodiversity. Schneider Electric has reported that most of its Biodiversity impact stems from 1) changes in land use (establishment of new factories) and 5) Climate Change (Greenhouse Gas emissions).
While GBS is an effective method for a simplified assessment of the impact of corporate activities on Biodiversity, room for improvement in the future has been pointed out.
When a company clears rainforests to build a factory, it uses the "Impact Factor" stored in the GBS database to estimate MSA. If the MSA of the rainforest is 100% and the MSA of the factory is 10%, the impact on MSA due to this land use change would be 100% - 10% = 90%. If MSA changes without accompanying a land use change (e.g., if a rainforest degrades without fragmentation), the impact on Biodiversity associated with land use is counted as "zero."
We believe that a mechanism capable of easily enabling a more granular assessment is needed for the efforts of individual companies to improve Biodiversity to be appropriately monitored and evaluated.
GLOBIO3: A Framework to Investigate Options for Reducing Global Terrestrial Biodiversity Loss
(Source, 2009)
Finally, we will briefly introduce the research report from the original paper on GLOBIO version 3, which was mentioned in the report above.
Here, we will focus on two points: the characteristics of MSA (compared to other indicators) discussed in the first half, and the scenario analysis studied in this paper (for details on how MSA is specifically calculated, please refer to this paper).
Characteristics of MSA
Firstly, MSA is similar to the Biodiversity Integrity Index and Biodiversity Intactness Index, but the difference lies in MSA giving equal weight to all land, whereas BII places greater weight on species-rich areas.
It is also emphasized that MSA alone cannot fully assess Biodiversity, and it needs to be considered in conjunction with other indicators such as STAR (Species Threat Abatement and Recovery).
Scenario Analysis
This paper evaluates the following three policies, considered effective for suppressing MSA decline, using GLOBIO. Here, we introduce the analysis results of the second scenario: promoting sustainable plantations.
Climate Change Mitigation Through Energy Policy
Plantation Forests
Protected areas
In general, afforestation with commercially valuable fast-growing tree species like acacia and eucalyptus is known for low Biodiversity.
However, especially in developing countries, given that natural forests (with high Biodiversity) are being cleared to meet timber demand and that timber demand will continue to grow with population increase, GLOBIO3 was used to verify the effect of promoting plantations to meet timber demand and suppress the decline of natural forests.
The scenario analysis results reported that while an initial decrease in MSA is observed due to the promotion of plantations, MSA gradually improves with the recovery of natural forests, and further MSA improvement is expected in the long term beyond 2050.
News from sustainacraft
● We joined the 30by30 Alliance.
- As one of the proposed targets in the "Post-2020 Global Biodiversity Framework," the "30by30 target" aims to conserve 30% of land and sea by 2030.
- Our company has joined the 30by30 Alliance, a coalition of volunteers working towards achieving this 30by30 target domestically.
- The formulation of the 30by30 roadmap and the launch of the 30by30 Alliance were recently announced by the Ministry of the Environment.
● We will exhibit at Viva Technology 2022.
- We will be exhibiting at Viva Technology 2022, which will be held in Paris in June.
- Further details will be announced soon.
Closing remarks
As introduced in the GLOBIO3 paper, promoting plantations of single tree species is not necessarily negative in terms of overall impact, not only for carbon sequestration but also for Biodiversity (provided that mechanisms to suppress the felling of natural forests for timber in other areas are functioning).
We also introduced that MSA (and other indicators) alone cannot be a complete indicator of Biodiversity, and discussions can unfold in various directions depending on whether one considers a 10-year timeframe or a long-term timeframe beyond 2050.
These are good examples of the difficulty in quantitatively assessing the impact of human activities on Natural Capital. The "craft" in our company name signifies skilled craftsmanship and manual industry, reflecting our desire to carefully handle and interpret data.
This concludes Sustainacraft's Newsletter #2. In this newsletter, we plan to disseminate information on NbS in Japanese bi-weekly to monthly.
Our company profile materials are available here for your reference.
Disclaimers:
This newsletter is not financial advice. So do your own research and due diligence.