
Verra's proposed Enhanced Forest Sequestration with Dynamic Baselines and Randomized Control Trials
This is a new issue of newsletter from Deloitte Tohmatsu Sustainacraft.
Methodology Updates is a series covering carbon and biodiversity credit methodologies. This article introduces Verra's latest Enhanced Forest Sequestration methodology that is currently in public consultation period.
For inquiries, please contact us here.
Author: Nick Lau (Applied Scientist)
1. Introduction
Verra has opened a public consultation on draft methodology M0274, titled "Enhanced Forest Sequestration with Dynamic Baselines using Randomized Control Trials," running from May 6 through June 8, 2026. M0274 proposes a framework for generating carbon credits from Improved Forest Management (IFM) projects that apply localized biological or silvicultural treatments, such as liana removal, nutrient amendments, or fungal inoculation, to increase the rate of forest carbon accumulation. This is a distinct category from most IFM activity: rather than generating credits by avoiding future carbon losses through harvest management changes, M0274 targets the direct acceleration of forest growth within existing forests.
The methodology's accounting structure is built around a paired plot design. Treated forest plots are measured against untreated controls within the same project area, and a separate system of external benchmark forests validates that those internal controls remain representative of business-as-usual conditions. This design is motivated by longstanding criticisms of how IFM project baselines are constructed, and by the attribution challenge specific to stand-level biological treatments, where carbon effects are smaller and more variable than those of broad management changes. This newsletter describes the background and motivation for M0274's design, what activities and eligibility conditions it covers, how the paired plot accounting system and Integrity Benchmark work, and how M0274 relates to Verra's existing IFM methodology VM0045.


2. Background: IFM Baseline Accounting and Recent Methodological Developments
Carbon credits from IFM projects are calculated as the difference between observed forest carbon stocks and a counterfactual baseline representing what would have happened without the project. For most of the history of voluntary carbon markets, these baselines have been constructed through long-term projections of future harvest behavior, forest growth trajectories, and timber market conditions. This approach attracted sustained criticism on several grounds: the underlying modeling choices are often opaque and difficult for third-party auditors to validate; developers have an incentive to select assumptions that produce high baselines; and because baselines are fixed at project start, they cannot account for subsequent changes in market conditions, land use trends, or disturbance regimes.
In response, methodology developers moved toward approaches that rely on observed data rather than long-range projections. Verra's VM0045 introduced dynamic composite baselines for IFM projects: rather than fixing a baseline using growth models, it constructs the baseline from continuously monitored external forest inventory plots matched to the project area using k-nearest-neighbor methods, and updates it as those external forests evolve. This ties the baseline to observable, contemporaneous forest conditions in the surrounding landscape.
M0274 extends this direction by moving the primary comparison inside the project boundary. Rather than matching the project area to external forests to infer a counterfactual, M0274 establishes untreated control plots within the project itself and measures them alongside treated plots in real time. This paired internal structure is particularly suited to enhanced sequestration activities, where the treatment effect is localized and needs to be isolated from background ecological variability at fine spatial scale, something a regional external baseline is less equipped to do.
3. Eligible Activities and Project Requirements
M0274 applies to IFM projects that apply biological or silvicultural treatments to specific forest stands with the aim of increasing their rate of carbon accumulation. The methodology refers to these as "enhanced sequestration treatments," and examples in the draft include liana and vine removal, crown release treatments, nutrient amendments, selective fertilization, and fungal inoculation.These treatments may target individual trees, but carbon accounting is conducted at the plot or stratum level. The methodology measures the aggregate change in carbon stocks across treated areas, not outcomes for individual trees.All eligible project areas must remain forests throughout the crediting period.
A project under M0274 applies one of these treatments to defined areas within a managed forest, then measures whether those areas accumulate more carbon than comparable untreated areas in the same forest over the same period. The difference between the two, if statistically significant, is the basis for generating carbon credits. An external monitoring system runs in parallel to verify that the untreated comparison areas remain representative of normal forest conditions, guarding against manipulation of the baseline. If either the treatment effect cannot be statistically demonstrated or the comparison areas fail the external validation, credits are not issued for that period.
The accounting framework that supports this is built around two systems. The first is the paired treatment-control plot system, which handles the credit calculation itself: treated and untreated plots are established within the project area, measured concurrently, and the carbon difference between them forms the additionality estimate. The second is the Integrity Benchmark, which operates as a validation layer: external reference forests outside the project boundary are monitored by remote sensing to ensure the internal untreated plots remain honest representations of business-as-usual conditions. Before those systems are described in detail, the sections below set out the eligibility conditions, environmental safeguards, and carbon accounting scope that projects must satisfy to qualify under the methodology.
3.1 Eligibility Conditions
For a forest to be eligible under M0274, it must meet at least one of three conditions during the ten years prior to project start: i) it has experienced significant human disturbance such as canopy removal or active management; ii) it is subject to commercial timber harvesting under rotations no shorter than the regional norm or legal minimum; or iii) it has experienced natural disturbance such as windthrow or pest damage in a non-timber production forest.
Because some eligible activities involve introducing biological agents into forest ecosystems, the methodology imposes environmental safeguards. Project developers must document, using peer-reviewed literature or certification from a qualified body, that the planned interventions do not cause adverse ecological impacts. Projects must also implement containment measures to prevent unintended introduction of non-native species or pathogens, and must conduct screening for invasive species risks.
3.2 Carbon Pools and Emissions Sources
The methodology requires accounting for aboveground and belowground tree biomass. Harvested wood products must be included when harvesting occurs, using a 100-year average carbon storage factor. Dead wood and non-tree woody biomass are included unless they fall below the threshold of 5% of total project emissions or removals. Soil organic carbon is excluded because the applicable conditions rule out hydrological manipulation of peatlands. When nitrogen-based fertilizers are used, the methodology requires calculation of both direct and indirect nitrous oxide emissions using IPCC guidelines.
4. Accounting Framework Overview
M0274's accounting framework rests on two connected systems that work at different spatial scales and serve distinct functions.
The first is the paired treatment-control plot system, which is the primary mechanism for estimating additionality. This system mirrors Randomized Controlled Trials commonly used in medical experiments to estimate the effect of a treatment by comparing outcomes between a treatment group and a control group. The project area is divided into paired plots: one plot in each pair receives the enhanced sequestration treatment, while the other is left untreated. Both are measured repeatedly through the crediting period. The difference in carbon stock change between the treated and untreated plot in each pair is the basis for calculating how much additional carbon the treatment produced. Because both plots experience the same regional climate and ecological conditions simultaneously, the differencing removes the influence of external variability and isolates the treatment effect.
The second is the Integrity Benchmark system, which operates as a validation layer rather than a credit-calculation mechanism. Internal control plots are located inside the project boundary and managed by the project developer, which creates the possibility that a developer could manipulate those controls to inflate the apparent treatment effect. The Integrity Benchmark addresses this by comparing the internal control plots against a set of external reference forests outside the project boundary using remotely sensed vegetation indicators. If the internal controls deviate substantially from what comparable external forests are doing, the project is flagged and credit issuance is suspended.
Together, the two systems separate the task of measuring the treatment effect from the task of validating the baseline used to measure it. The paired plot system produces the credit estimate; the Integrity Benchmark evaluates whether the control plots located inside the project boundary remain a credible representation of what the forest would have done without the treatment.
Importantly, credits are only issued in a given monitoring period if the difference between project plots and internal control plots is statistically significant; if the measured difference does not clear that threshold, no VCUs are issued for that period.
5. The Paired Treatment-Control Plot System
5.1 Plot Setup and Pairing
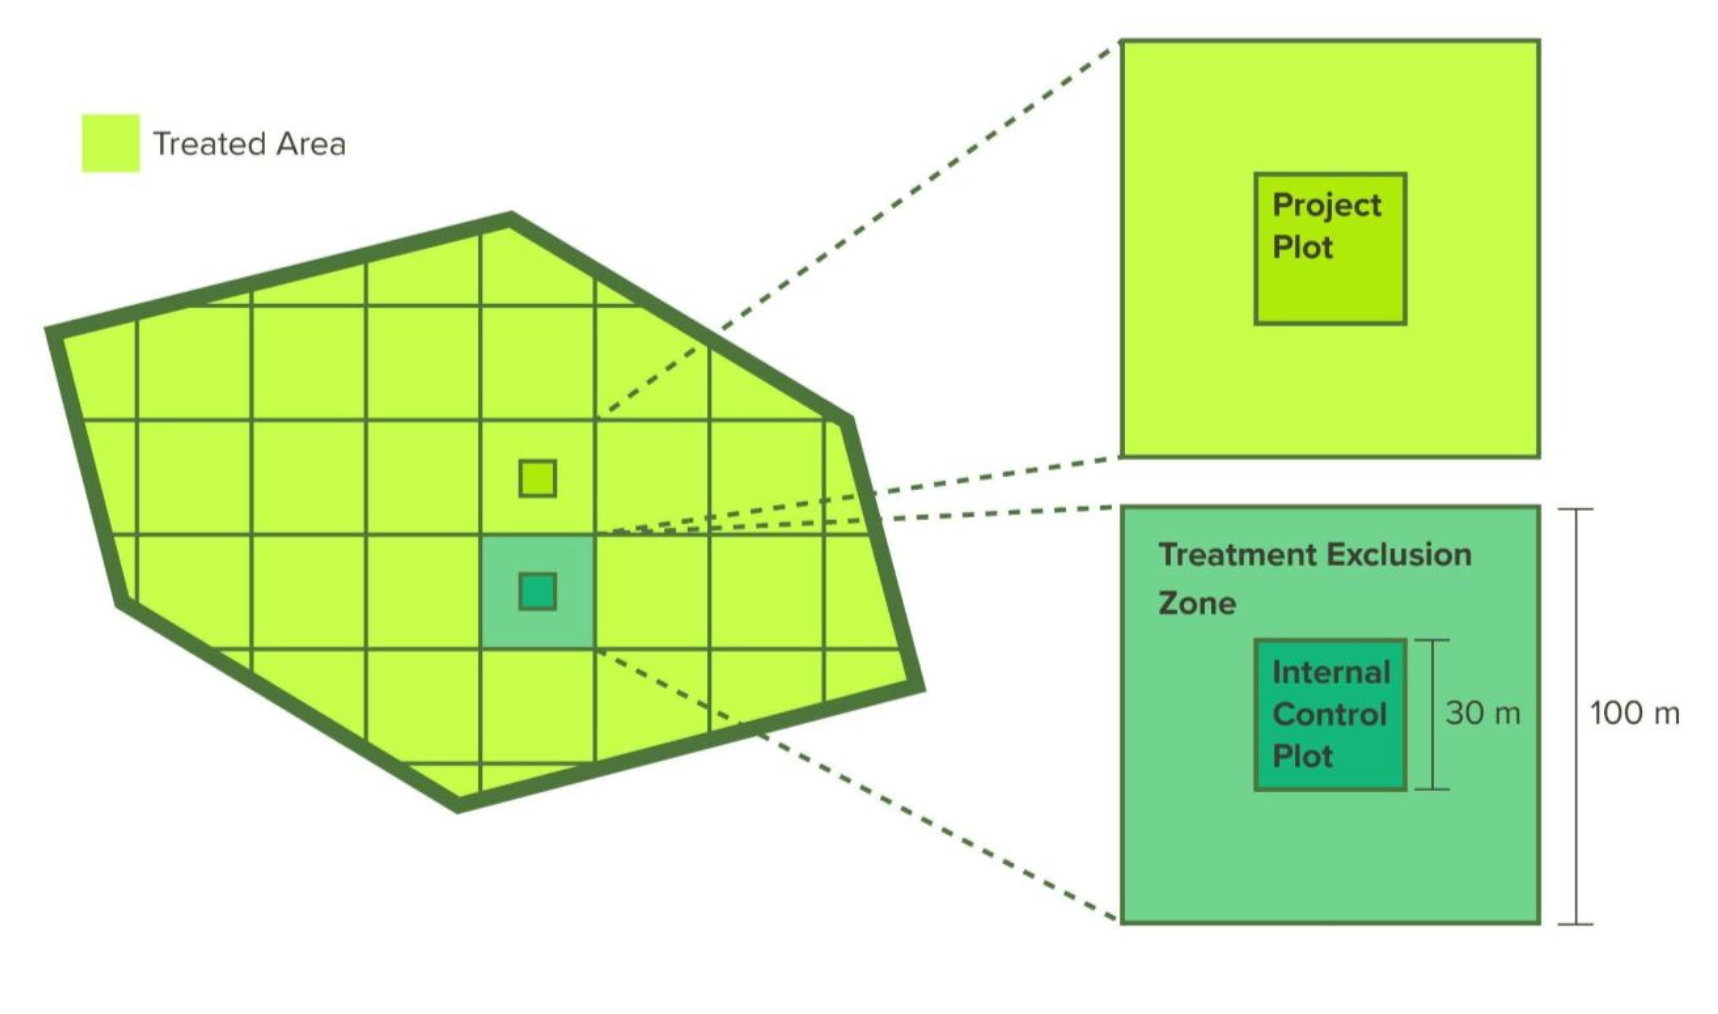
The project area is divided into a grid. Each cell must be at least 30 by 30 meters, and cells that cross the project boundary are excluded. Cells are then organized into pairs, each consisting of one project plot that will receive the treatment and one internal control plot that will not. Each pair forms a "sample unit."
Two pairing methods are permitted. First, “neighbor pair analysis” randomly selects grid cells and then randomly picks an adjoining cell to form each pair, assigning one to treatment and one to control. Second, “matched pair analysis” uses statistical matching to identify cells with similar ecological characteristics across the project area, using covariates such as initial carbon stocks, vegetation type, slope, and elevation. Matching employs propensity scores or k-nearest-neighbor methods, minimizing Mahalanobis distance. Within each matched pair, one cell is randomly assigned to treatment and the other to control.
Before the project begins, developers must conduct a power analysis to determine the number of sample units required to detect the expected treatment effect. The sampling design must be large enough that, if the treatment genuinely produces additional carbon, there is at least an 80% chance the statistical test will detect it; and the threshold for declaring a result positive is set such that there is only a 5% chance of doing so when the treatment had no real effect.
5.2 Estimating Additional Sequestration
Carbon stocks in both project plots and control plots are measured through repeated field inventories throughout the crediting period. The additional sequestration attributable to the treatment in each sample unit is calculated as the difference in carbon stock change between the project plot and its paired control:
Net additional sequestration (per sample unit) = Change in carbon stocks in project plot − Change in carbon stocks in control plot
These per-unit estimates are aggregated across all sample units and strata, weighted by area, to produce the total project-level additional removals.
Because both plots within a pair experience the same regional climate, weather events, and ecological conditions during the same time period, variability from those external factors are assumed to affect both plots equally. The difference calculation removes their influence, isolating the effect of the treatment.
5.3 Credit Issuance Conditions
Credits are issued for a given monitoring period only if the measured difference in carbon accumulation between project plots and control plots is statistically significant. If the difference is not statistically positive, no VCUs are issued for that period.
For ex-ante credit estimates submitted in the project description, a minimum uncertainty deduction of 10% is applied. For ex-post estimates at verification, the uncertainty deduction is calculated from the 95% confidence interval half-width of the sample, based on observed sampling error.
5.4 Treatment Exclusion Zones
The methodology requires buffer zones around each internal control plot from which treatments are excluded. These treatment exclusion zones are intended to prevent the biological or chemical effects of treatments in project plots from extending into adjacent control plots and affecting the comparison. Interventions that cannot be adequately spatially contained are not eligible under the methodology.
6. The Integrity Benchmark System
6.1 Baseline Manipulation Risk
Because internal control plots are located within the project boundary and managed by the project developer, the methodology identifies a potential integrity concern: a developer could intentionally degrade or harvest internal control plots at a higher rate than project plots, which would produce a larger apparent gap between treated and untreated forests and result in more credits. The Integrity Benchmark is the mechanism M0274 uses to detect and respond to this risk.
6.2 External Benchmark Plots and the Stocking Index
For each internal control plot, the methodology requires a pool of external benchmark plots selected from forests outside the project boundary. These external plots must be located within 100 kilometers of the project area, within the same ecoregion, and under similar land tenure conditions. They are matched to the internal controls using a remotely sensed Stocking Index, which may be derived from Landsat-based normalized difference fraction indices (NDFI), LiDAR-derived canopy height, canopy cover, or other vegetation indicators correlated with carbon stocks. The stocking index map must have a spatial resolution no coarser than 100 by 100 meters and must be generated from source datasets no coarser than 30 by 30 meters. Matching uses k-nearest-neighbor methods with optimal, non-replacement matching.
At a minimum of three monitoring points during the project period, the methodology computes the average Stocking Index for each stratum of internal control plots and compares it to the distribution of Stocking Indices from the matched external benchmark plots. The internal control average must fall within the 95th percentile range of the external benchmark distribution. If the internal control average falls below the lower bound of that range, the stratum fails the Integrity Benchmark test. When this occurs, no VCUs are issued for the affected stratum in that verification period, and the stratum loses eligibility for future credit issuance.
6.3 Harvest Intensity Check
In addition to the Stocking Index comparison, the methodology requires a separate harvest intensity check. If the harvested biomass volume in internal control plots is both statistically significantly greater than in project plots (one-sided t-test, significance level 0.05) and more than 20% greater in absolute volume, the project fails the check and no credits are issued. Both conditions must be met simultaneously.
This check exists because the Stocking Index, operating through remote sensing, is well suited to detecting broad degradation of internal control plots but less suited to detecting targeted selective harvesting, which would drain carbon stocks from control plots without necessarily being visible in vegetation indices at the stocking index's resolution. The magnitude threshold additionally prevents statistically significant but materially negligible harvest differences from triggering a failure at high sample sizes.
7. Comparison with VM0045
M0274 explicitly cites VM0045 as a source methodology, and the two share several structural features: both use k-nearest-neighbor matching to pair project areas with reference forests, both construct dynamic baselines from continuously monitored external plots, and both avoid reliance on long-term growth and yield projections. In that sense, M0274 continues the methodological direction VM0045 established for IFM.
The differences are equally significant. VM0045 is designed for broad management-regime changes, extending harvest rotations, reducing harvest intensity, designating conservation reserves, where the project intervention affects entire ownerships or landscapes. Its baseline is assembled from forests outside the project boundary and represents landscape-level business-as-usual conditions; the external plots are the baseline. M0274's baseline is internal: the untreated control plots within the project boundary serve as the direct counterfactual, and the external benchmark plots serve a different function — validating that those internal controls remain honest, rather than constructing the baseline itself.
A further distinction concerns how credits are issued. In VM0045, credits follow from measured stock change relative to the external baseline. In M0274, credits require a statistically significant positive difference between project plots and their paired internal controls; if the difference does not clear that threshold in a given monitoring period, no VCUs are issued for that period regardless of observed growth in the project plots.
These structural differences reflect the different accounting problems each methodology is designed to solve. VM0045 addresses the question of what a forest landscape would have looked like under business-as-usual management. M0274 addresses the narrower question of how much additional carbon a specific localized biological treatment produced within a forest that is itself being actively managed, requiring fine-scale, paired, concurrent measurement rather than a regional external reference.
The public consultation period for M0274 runs through June 8, 2026. Comments on the methodology can be submitted through Verra's consultation portal.
That concludes this month's newsletter on methodologies (2/2).
Our company profile materials are available here for your reference.
Disclaimers:
This newsletter is not financial advice. Please do your own research and due diligence.